Demi lune farming in Niger attempts to cultivate land that is suffering from drought and desertification OCHA/Michele Cattani
Across Niger’s drylands, farmers cultivate land shaped by arid conditions and fragile soils, where rainfall is limited and often runs off quickly.
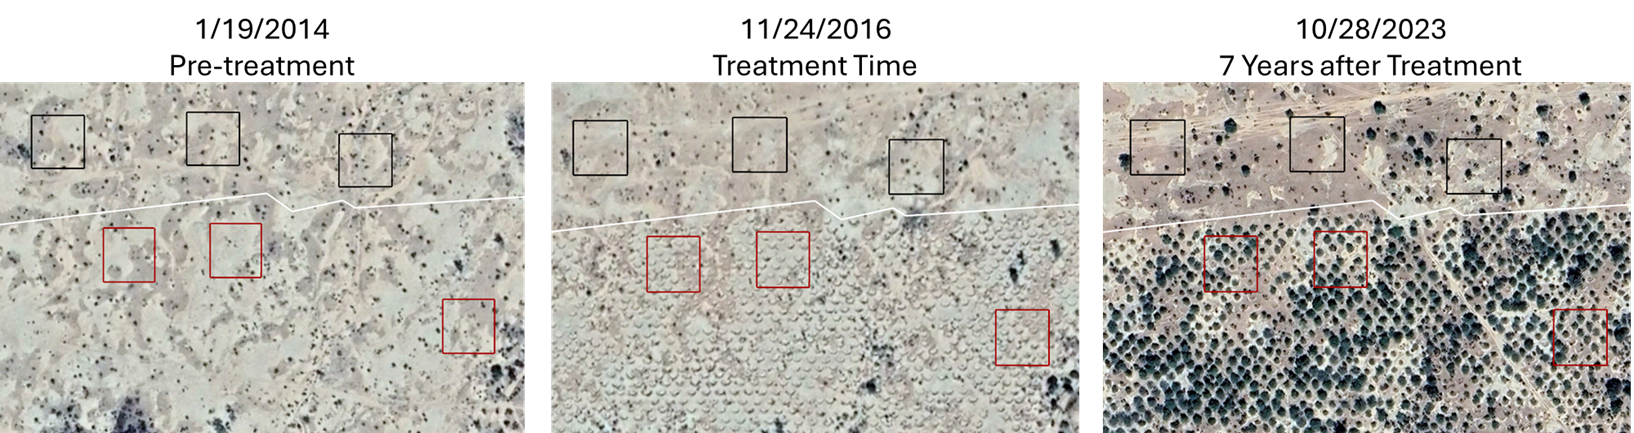
When rainwater runs off instead of soaking into the soil, it carries fertile topsoil away, reducing productivity over time. Over time, repeated runoff accelerates land degradation and makes rainfed farming less reliable, with direct implications for food security and climate resilience. Demi-lunes, shallow, semicircular earthworks often called half-moons, offer a practical response. Arranged in repeating arcs across gentle slopes, they slow runoff, capture sediment, and retain moisture long enough for crops and natural vegetation to take root.
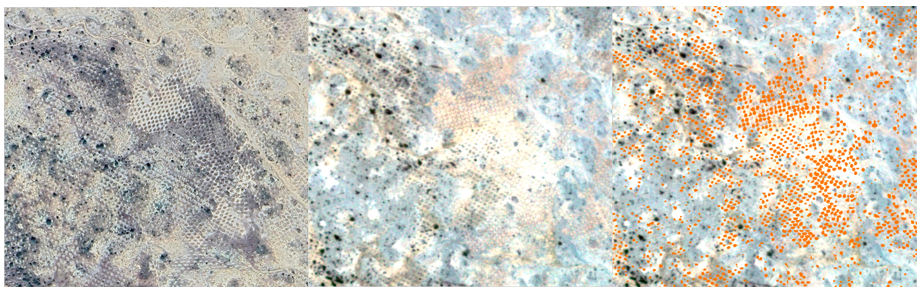
Demi-lunes are also visible in high resolution satellite imagery, often as clustered semicircles in a distinctive fish scale pattern. That visibility makes them a strong candidate for an Earth observation use case, especially for long term monitoring as an investment into demi-lunes scales.
The processes laid out in this blog build on foundational evidence from Niger that put demi-lunes on the map for impact evaluation. In a randomized evaluation led by Kelsey Jack and coauthors, training drove dramatic increases in demi-lune adoption, and the intervention showed sustained benefits beyond the initial rollout. That evidence established that demi-lunes can be adopted and can deliver impacts. The next challenge was scale: tracking where demi-lunes are built, how they spread over time, and where outcomes appear, without relying on constant field visits. That is where Earth observation becomes the natural next step, and why AidData invested in building a monitoring database.
GeoField is highlighting this effort because it shows how Earth observation can move from a promising research use case to a practical evaluation asset. Two AidData researchers led the core work behind the demi-lunes database, with broader research leadership from Dr. Kunwar Singh. Yuntian Bi, a geospatial analyst in AidData’s Research and Evaluation Unit, built the visual interpretation and digitization workflow that maps demi-lunes across large areas and records when they first appear in imagery. Dong Luo, a Postdoctoral Fellow at AidData and William and Mary’s Global Research Institute and a member of the GeoField Initiative, developed the deep learning workflow that detects individual demi-lunes in high resolution imagery and helps automate updates as new data become available.
Think of the database as two complementary layers that solve different parts of the same monitoring problem. Yuntian’s centroid point layer prioritizes consistency, coverage, and interpretability for tracking presence and spread over time. Dong’s object detection layer prioritizes automation, precision, and faster updates where high resolution imagery is available. The point of this database is to move from mapping to evidence. Together, these layers support geospatial impact evaluation on what works, where, and under what conditions, even as programs expand beyond the original sites.
Digitization was led by Yuntian Bi with assistance from Sophia Shebay, an undergraduate student at William and Mary.
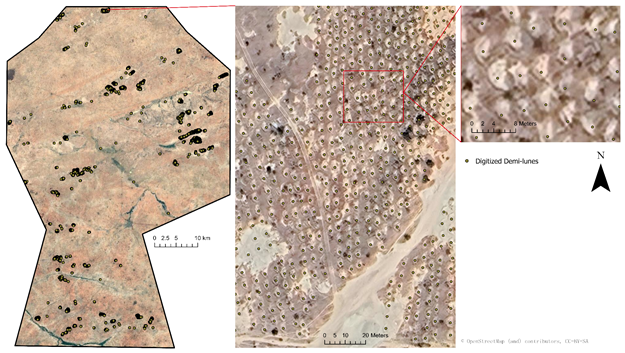
The work started with a deceptively hard task. In high-resolution imagery of Niger, demi-lunes become easy to spot once you know what to look for. But the landscape is vast, and image quality varies widely, making them difficult to identify consistently. The team mapped demi-lune locations through systematic visual interpretation using key visual elements such as tone, texture, color, and contrast in multi temporal, high resolution imagery in Google Earth Pro. Digitization and attribute management were conducted in ArcGIS Pro, using the most recent Google satellite imagery available, typically from late 2023 through early 2025 as the primary reference.
Each structure was digitized as a centroid point in ArcGIS Pro, with attributes assigned to record the imagery year, earliest visible presence, and latest confirmed absence. Because imagery availability varies by place and year, these dates should be read as observation bounds rather than exact construction dates. Earlier imagery was inspected to validate ambiguous cases and support temporal accuracy. Features obscured by vegetation, erosion, or poor image quality were excluded to maintain consistency.
The payoff is a dataset that is easy to interpret and immediately useful for evaluation logic. As Yuntian described it, “We used those points to create treatment and reference samples, areas with demi-lunes and areas without demi-lunes.” The points become the building blocks for defining where demi-lunes are present and where they are not.
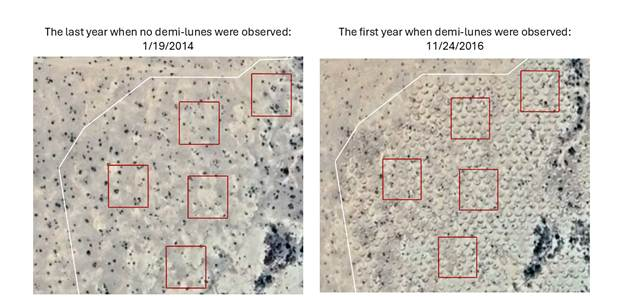
A major advantage of this workflow is that it supports a timeline rather than a snapshot. By recording the earliest visible presence and latest confirmed absence, the team can infer approximate construction windows and build an adoption timeline that can be used in analysis and monitoring.
To keep the dataset defensible, mapping accuracy was evaluated using three random samples of 1,000 points. The mean positional accuracy was 98.3 percent, with errors primarily attributable to image quality or overlapping structures. The final dataset included over 180,000 digitized demi-lunes, forming the spatial foundation for treatment classification
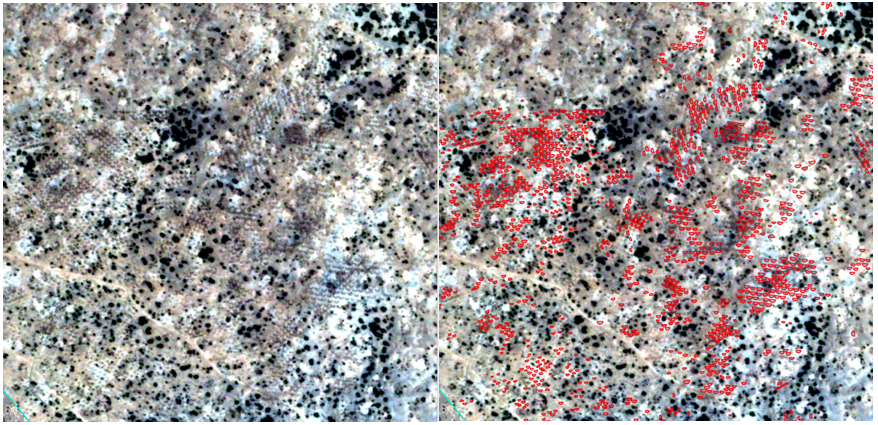
Manual digitization can produce a high confidence baseline, but it does not scale easily across time and geography. Dong’s workflow tackles that constraint directly, using semi-supervised deep learning to detect individual demi-lunes from high resolution imagery.
One practical constraint shows up quickly in this kind of work. The imagery many analysts use for visual confirmation is not available for download and analysis. Dong explaniend:
“Google Earth Pro can provide very high spatial resolution, but you cannot download it. You can just download for visualization.”
To build a model that can be trained, evaluated, and reused, the workflow relies on one date of cloud free SkySat imagery at 0.5 meter resolution:
This approach is designed to work at the level of individual structures. Instead of recording a centroid point, it learns from annotated examples of demi-lunes and background features so it can predict where demi-lunes occur in new imagery.
In Dong’s workflow, the annotated SkySat patches were split 80/20 for training and validation versus evaluation. Reported metrics include an overall accuracy of 96.11 percent and a user’s accuracy for the demi lune class of 78.52 percent. User’s accuracy reflects how often predicted demi-lunes are actually demi-lunes.
For a non-technical audience, the key takeaway is not the headline accuracy number, but rather what the model identifies correctly and what it still misses. In this workflow, the model tends to underestimate some demi-lunes, likely in part because of the imagery itself—the SkySat data used here captures only four spectral bands.
When taken together, these pipelines produce a single monitoring and analysis system with two complementary layers. The centroid based visual interpretation layer is the canonical, large area reference and supports transparent counting, density mapping, and diffusion analysis.
The deep learning derived object layer adds automation and higher resolution structure mapping where imagery allows. Together, they enable concrete evaluation questions, such as where demi-lunes are adopted fastest, how quickly benefits emerge, and whether adoption and impacts diffuse beyond original intervention sites.
The combined database has already been used to conduct a Geospatial Impact Evaluation (GIE) of demi-lune interventions in Niger, demonstrating their effectiveness in improving soil moisture and agricultural activity. Framed this way, the database becomes a practical foundation for GIE on what works, where, and under what conditions.
The next phase is about moving from a strong proof of concept to an open, reusable system. Immediate priorities are:
Once this use case is complete, we plan to make the full database openly accessible through AidData’s channels. The intent is for ministries, NGOs, and researchers to reuse and apply the workflows to monitor restoration investments, design evaluations, and update maps as new imagery becomes available.
Demi-lune digitization and attribute management were led by Yuntian Bi, Geospatial Analyst in the Research and Evaluation Unit at AidData, with assistance from Sophia Shebay, an undergraduate student at William and Mary. Individual demi-lune detection using a semi supervised learning model was led by Dong Luo, Postdoctoral Fellow at AidData and William and Mary’s Global Research Institute, with Taru Meshram of the Computer Science Department at the University of Massachusetts Amherst contributing to model development. A special thanks to Dr. Kunwar Singh and Dr. Ariel BenYishay for leading this effort.
