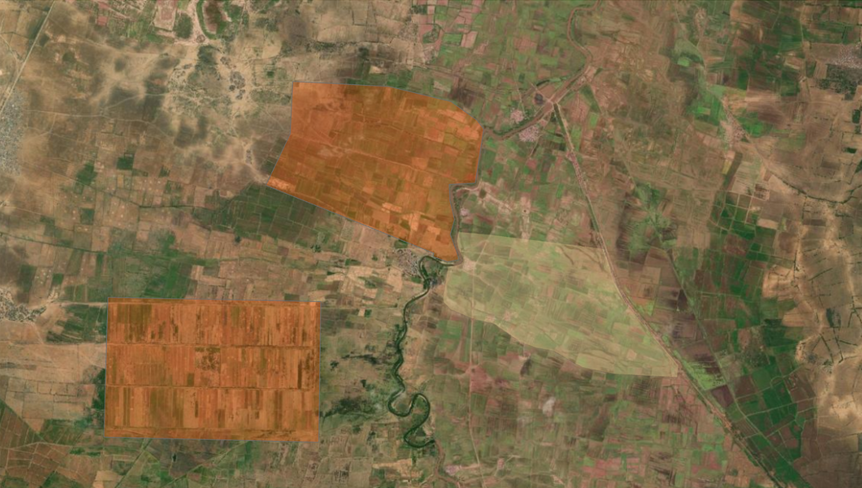
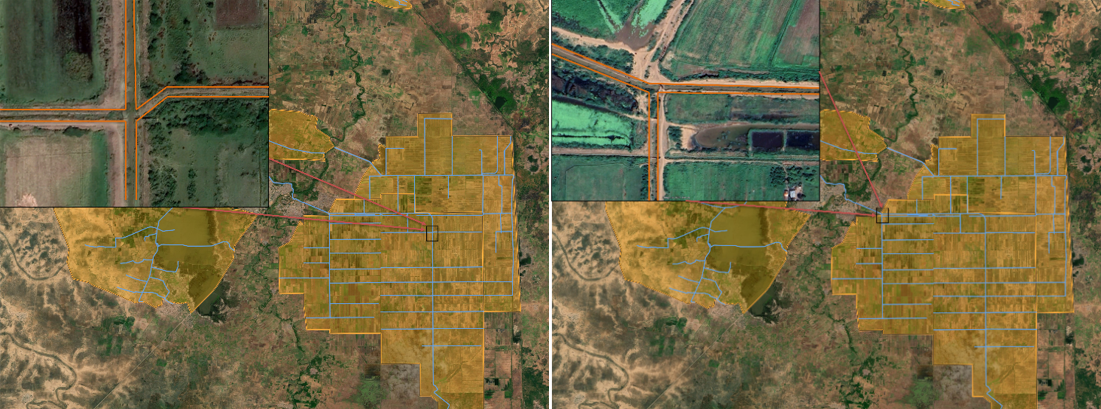
Satellite view of the agricultural landscape in the Shabelle study area, showing the canal network and cultivated plots that depend on water flow from the river.
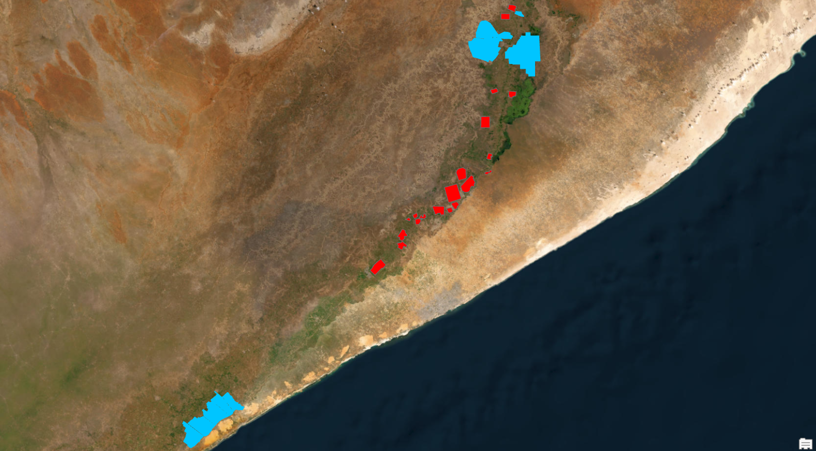
In Southern Somalia, two large clusters of agricultural land sit along the middle stretch of the Shabelle River. Farmers there depend on a network of primary, secondary, and tertiary canals to move water from the river to their plots. Without that water, there is no farming. Before 1990, these systems were maintained under a functional national government. After the government's collapse, the infrastructure fell into widespread disrepair. Canals silted up, vegetation grew through channels, and the flow of water that farmers relied on slowed to a trickle.
Between 2019 and 2023, the UN funded and implemented canal rehabilitation in two districts along the Shabelle: Marka in the south and Jowhar to the north. Combined, the interventions rehabilitated more than 370 kilometers of primary, secondary, and tertiary canals. The work was carried out by local contractors, funded through UN field offices, and designed to restore water access for farming communities in one of the most climate-fragile and conflict-affected agricultural zones in the world.
In this blog post, we answer not only whether the intervention worked, but also how the analysis was constructed, what findings it produced, and what the approach demonstrates for evaluating infrastructure programs that are concentrated in a few locations.
This analysis was conducted by Dr. Ariel BenYishay, Pratap Khattri, and Jacob Hall at William and Mary's AidData lab, in partnership with Kamran Niazi, AnaPaula de la O Campos, Rebecca Pietrelli from FAO's Agrifood Economics Division unit. The results were presented to FAO staff in Rome in early 2026.
Before getting into the details of the analysis, it is worth being precise about what irrigation canal rehabilitation typically involves. A canal in disrepair can take many shapes. Vegetation grows through the channel. Sediment builds up over years. Without dredging and concrete lining to smooth the flow path, water that enters the system encounters friction, pools, and diverts before reaching the fields it’s meant to serve.
Rehabilitation addresses those physical conditions directly: clearing obstructions, dredging accumulated sediment, and in some cases, lining channels so water can move freely from river to field.
Evaluating any intervention’s impacts requires estimating a counterfactual: some way of assessing what would have happened in the treated areas if the canals had not been rehabilitated. In most approaches, this requires constructing a set of untreated areas whose conditions are similar to those in the treated areas (absent the program).
The most common approach in this kind of work is difference-in-differences, which compares changes in outcomes between treated and comparison fields before and after an intervention. That method depends on a key assumption: that treatment in one field does not affect outcomes in neighboring units.
But in the case of the canal rehabilitation in Somalia, the canal rehabilitation was concentrated in two treated clusters, which were large, dense agricultural areas. Plots sit next to one another. Water that enters one part of the system can affect adjacent fields, creating spillovers across space. There is no clean boundary where treatment effects stop. As Pratap explained: "With plots being close to each other in this very tight cluster, that's just not possible for us to prove in a plot-level analysis."
To account for this the analysis needed to consider each cluster as the main treatment scale, and comparison units needed to similarly be comparison clusters of fields. But with only a few treated clusters, it might become very difficult to identify comparison clusters that actually match the two treated clusters closely. In other words, there may be no obvious comparison cluster that sufficiently resembled a treated cluster before the intervention.
Given this challenge, the team shifted to another approach instead.
Synthetic controls (SC) work by building a composite comparison unit from a pool of real untreated areas. Instead of finding a single location similar to the treated area, the method uses a data-driven weighting procedure to combine multiple units into one “synthetic” unit that serves as the treated unit’s counterfactual.
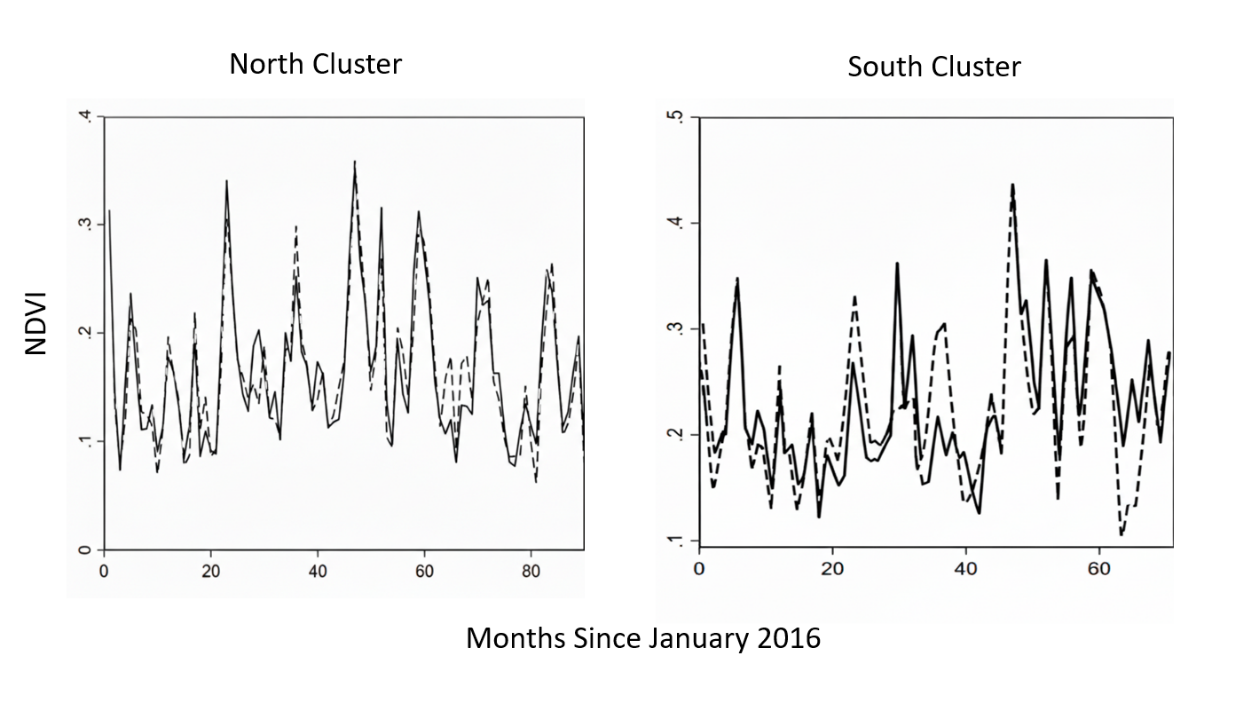
For this study, the team identified 45 comparison clusters along the Shabelle, in the corridor between the two treated clusters. Selecting those comparison sites required a customized workflow, since there are no plot-level administrative boundaries in this part of Somalia. The team used a FAO canal layer from 2018, overlaid it on pre-intervention high-resolution Google Earth imagery, and manually delineated clusters of plots around canal networks. Dense canal infrastructure in a region like this almost always indicates agricultural land use, and proximity to the treated areas made agroclimatic conditions comparable. The resulting synthetic control units closely tracked the treated units’ conditions in the run up to the intervention (i.e., re-treatment fit was strong). The synthetic control tracked Normalized Difference Vegetation Index (NDVI) and Soil-Adjusted Vegetation Index (SAVI) values in the treated clusters closely across the full pre-intervention period, even with the noise inherent in monthly vegetation index data.
The analysis used Sentinel-2 imagery at 10-meter resolution, processed through Google Earth Engine, spanning monthly observations from 2016 through 2024. Four indices were used:
The vegetation results were puzzling at first. NDVI and SAVI showed no meaningful change in either the northern or southern cluster following rehabilitation. The treated areas did not become greener relative to the synthetic control. The team ran robustness checks, including canal-buffer analyses restricted to 100-meter zones around individual canals, sub-command area breakdowns, and an alternative synthetic difference-in-differences approach. None of them produced evidence of a treatment effect.
That led to a different question: did the intervention actually change water conditions in the canals?
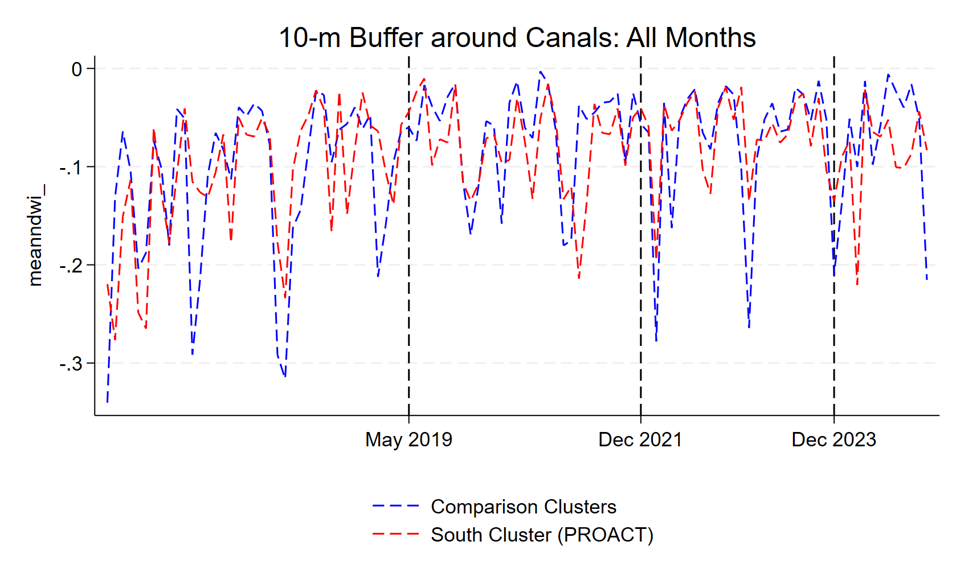
Looking at NDWI and LSWI within narrow 5-meter buffers directly around the canal network, the team found the answer. Water content in the canals showed no statistically meaningful change after rehabilitation. Near the river intake, imagery showed water present. Further down the system, the signal faded. The canals had been cleared, but something downstream was limiting flow.
The team did not have a definitive answer for why the rehabilitation did not improve water conditions at scale, but the operating environment pointed toward a likely explanation.
Both clusters, and particularly the southern one, operate in areas where conflict between government forces and armed groups has been reported. The intervention itself was constructed under significant security constraints. There might be reason to believe that some infrastructure damage occurred after construction, whether through direct destruction or through ongoing instability that prevented maintenance and operation, though the team did not have direct evidence to confirm this.
The key analytical point is that remote sensing made this visible. Without the water index analysis, the null vegetation outcome might have been attributed to poor adoption, drought conditions, or agronomic factors. The water index data pointed directly at the first stage of the causal chain: water was not flowing, and that had nothing to do with how farmers responded.
The Somalia study surfaces a set of practical takeaways worth carrying into similar work.
Synthetic controls are viable in agricultural settings. They are not widely used in this domain, but this study demonstrates that they can perform well even with noisy monthly vegetation data. When spillovers make difference-in-differences tricky to implement, synthetic controls may be a viable alternative, provided that a suitable comparison pool can be constructed.
Outcome selection should also follow causal logic. NDVI and SAVI are standard outputs for agricultural remote sensing. But testing the intervention's first stage, whether the physical infrastructure changed conditions, required water indices. Working outward from the mechanism rather than defaulting to vegetation outcomes improved the diagnostic value of the analysis considerably.
Retrospective evaluation has a place. This work used existing satellite archives to evaluate an intervention that was already complete. The full Sentinel-2 time series was available, the intervention timeline was documented, and the canal layer from FAO provided the spatial foundation. Retrospective remote sensing evaluation is not a substitute for prospective design, but it can produce evidence from programs where none would otherwise exist.
GeoField will continue to track applied remote sensing evaluation work in agricultural and infrastructure settings. Studies like this one, where the satellite record surfaces something that ground-based monitoring did not capture, are exactly the kind of evidence base that justifies investment in Earth observation for development program management.
This analysis was funded by the Gates Foundation’s GeoField grant to AidData, in partnership with DevGlobal and MercyCorps. The FAO’s Agrifood Economics and Policy Division supported the work of Ana Paula De la O Campos, Kamran Khan Niazi, and Rebecca Pietrelli.
